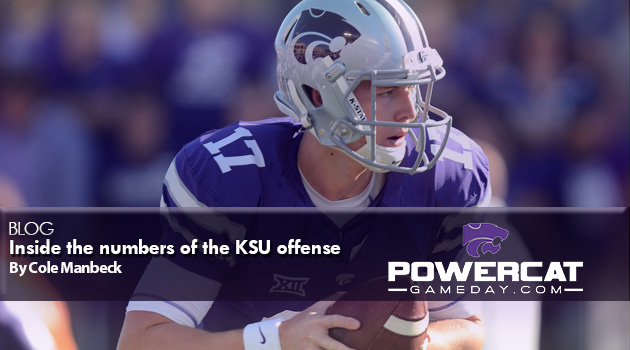
Inside the numbers on the K-State offense
By Cole Manbeck
When you think of Kansas State’s offense, you might envision a unit that grinds out first down after first down while owning time of possession. And that’s true. The Wildcats have ranked in the top 25 nationally in time of possession in six of the past seven seasons.
But just like any football team, K-State’s offense also relies on explosive plays. Ten to 15-play drives are great, but they aren’t always sustainable, and the longer a drive, the more likely a mistake occurs that results in either a turnover, sack or drive-altering penalty.
K-State’s offense struggled with big plays last season. According to SBNation’s Bill Connelly, the Wildcats only had eight plays that went for 40 yards or more, ranking 112th nationally. K-State’s 147 plays of 10 yards or more ranked 107th.
The folks at unfairweatherfan.com do a nice job of analyzing big plays in college football in 2015. They categorize big plays as completions of 20 yards or more and running attempts of 10 or more yards. Based off that analysis, K-State had a total of 95 big plays in 2015, averaging a big play on 10.8 percent of its offensive snaps. Only KU had a lower big-play percentage in the Big 12 at 8.5 percent. The Big 12 Conference led the country in big-play percentage last season at 13.5 percent, so K-State was nearly three percent below the league average.
K-State only completed 35 passes for 20-plus yards last season, tying for next-to-last in the Big 12. Only Texas had less with 30. The Big 12 average for big passing plays was 51 completions of 20 yards or more. So K-State was well below the average, and that’s not taking into account that the Wildcats, Texas and KU significantly dragged down the average number of 51 for the league.
For comparison’s sake, I charted K-State’s passing plays in 2014. The Wildcats recorded 53 passing plays of 20-plus yards. Although that’s not truly a fair comparison with Jake Waters at quarterback and an All-American in Tyler Lockett at receiver along with Curry Sexton, another solid receiver opposite of Lockett that season.
Many get caught up with the Wildcats’ 47-percent completion percentage last season, and that number is bad, especially in this era of college football when so many short passes and bubble screens are thrown. It was the worst completion percentage since the 2001 K-State team completed just 44 percent of its passes.
However, if you analyze the history of Bill Snyder’s teams at K-State, he doesn’t always rely on high completion percentages for a successful offense. His teams from 1997-2003 completed an average of 49 percent of their passes, but they certainly didn’t have any trouble scoring points (excluding 2001). The Wildcats had one of the best rushing attacks in the country during that time (we’ll break down K-State’s running game later in this blog), but they also were very successful with big plays in the passing game, completing long passes to the likes of Darnell McDonald, Aaron Lockett, Quincy Morgan and James Terry.
Despite those poor completion percentages of those teams from 1997-03, K-State was successful in the passing game, averaging 8.3 yards per pass attempt during those seven seasons. K-State averaged just 6.5 yards per pass attempt in 2015, ranking 87th in the country. It was the lowest yards per pass attempt a K-State team has had since the 2004 season.
I expect this to change in 2016. The Wildcats are healthy at quarterback again with Jesse Ertz and Alex Delton returning from injuries. And Joe Hubener returns with a year of playing experience under his belt.
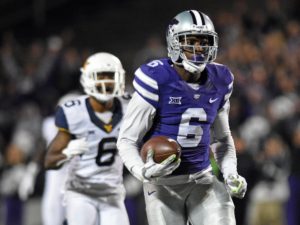
K-State also has more weapons at receiver. On paper, the Wildcats appear more physically imposing at receiver and possess more speed. Isaiah Zuber, a redshirt freshman, has drawn positive reviews and appears to be a potential big-play threat. Corey Sutton, a true freshman who arrived for spring ball, could see playing time in his first season based off how he has performed in the spring and fall camp. Lastly, Byron Pringle, a 6-foot-2 junior college transfer, is expected to be a key contributor after arriving for spring ball.
Can Pringle live up to the high expectations fans are placing on his shoulders? It will be difficult, as many junior college receivers who were heralded during the Snyder era didn’t put up big numbers until their second season of playing time. Quincy Morgan is an exception, but he had a redshirt year to become acclimated. However, Pringle was here for spring practice, and that could prove to be significant.
Heralded Junior college receivers during the Snyder-Era at K-State
| Player | Season | Receptions | Yards |
| Darnell McDonald | 1997 | 21 | 441 |
| 1998 | 75 | 1,092 |
| Player | Season | Receptions | Yards |
| Quincy Morgan | 1998 | Redshirted | Redshirted |
| 1999 | 42 | 1,007 | |
| 2000 | 64 | 1,166 |
| Player | Season | Receptions | Yards |
| Taco Wallace | 2001 | 2 | 17 |
| 2002 | 39 | 704 |
| Player | Season | Receptions | Yards |
| James Terry | 2002 | 28 | 561 |
| 2003 | 64 | 1,232 |
In addition, K-State returns its leading receiver from last season in Deante Burton. It’s important that the 6-2 receiver take a step forward in 2016. Burton was targeted 94 times in 2015, catching only 38 passes, according to SBNation’s Bill Connelly. That’s a bad number, and not entirely Burton’s fault, as that number includes over-throws, under-throws, etc. Very few of those incomplete passes were the result of a drop, but it does indicate the need to get more separation on his defender when running his routes.
Lastly, Dominique Heath is back and should provide a reliable weapon in the slot.
A closer look at the passing numbers during the Snyder-era (national rankings in parentheses where available)
| Season | Yards per pass | Completion % | Passing efficiency |
| 2015 | 6.5 (No. 87) | 47 (No. 120) | 107 (No. 108) |
| 2014 | 9.1 (No. 4) | 65 (No. 10) | 155 (No. 10) |
| 2013 | 9.3 (No. 6) | 62 (No. 39) | 155 (No. 12) |
| 2012 | 8.8 (No. 5) | 64 (No. 27) | 148 (No. 22) |
| 2011 | 6.8 (No. 70) | 57 (No. 75) | 126 (No. 67) |
| 2010 | 7.7 (No. 33) | 64 (No. 22) | 139 (No. 36) |
| 2009 | 6.6 (No. 88) | 58 (No. 52) | 109 (No. 82) |
| 2005 | 7.0 (No. 59) | 52 (No. 103) | 103 (No. 82) |
| 2004 | 6.0 (No. 101) | 55 (No. 70) | 100 (No. 85) |
| 2003 | 8.6 (No. 8) | 52 (No. 88) | 116 (No. 38) |
| 2002 | 9.3 (No. 1) | 54 | 147 (No. 8) |
| 2001 | 6.0 | 44 | 92 (No. 112) |
| 2000 | 8.2 | 49 | 128 (No. 32) |
| 1999 | 8.2 | 45 | N/A |
| 1998 | 9.6 | 57 | N/A |
| 1997 | 8.2 | 43 | 126 (No. 46) |
| 1996 | 6.7 | 58 | N/A |
| 1995 | 8.4 | 64 | N/A |
| 1994 | 7.5 | 58 | N/A |
| 1993 | 7.6 | 52 | N/A |
| 1992 | 6.1 | 48 | N/A |
| 1991 | 7.3 | 54 | N/A |
| 1990 | 7.2 | 52 | N/A |
| 1989 | 5.7 | 53 | N/A |
You’ll notice from the above numbers that K-State ranked in the top six nationally in yards per pass attempt from 2012-14. So last season was a significant step back. The
Wildcats also ranked in the top 25 in passing efficiency during the 2012-14 seasons. Last season, K-State was 108th nationally in efficiency.
Can K-State protect the quarterback?
The offensive line is the greatest area of concern on offense. K-State’s quarterbacks were sacked 9.7 percent of the time they dropped back for passes last season, ranking ninth in the Big 12. Only 11 teams in the country gave up a higher sack percentage than K-State. That number is far too high. However, part of that is because the Wildcats’ receivers struggled to get separation from corners, causing the quarterbacks to hang onto the football too long at times. Hubener also needed to do a better job of getting rid of the football.
The Wildcats are young and inexperienced on the line coming into this season. We’ll see if offensive line coach Charlie Dickey can get this group to gel with the right pieces. Scott Frantz, a redshirt freshman projected to start at left tackle, will be key to this unit. I think Frantz is going to be a very good player, and if he can prove to be solid this year, the Wildcats are set at a pivotal position for the future.
Sack percentage allowed by K-State’s offensive line from 2009-15
| Season | Sack % allowed | National Ranking |
| 2015 | 9.7 | 117 |
| 2014 | 6.3 | 67 |
| 2013 | 7.2 | 88 |
| 2012 | 4.3 | 34 |
| 2011 | 13.2 | 119 |
| 2010 | 9.9 | 116 |
| 2009 | 7.8 | 96 |
| Average | 8.3 | 91 |
Will K-State’s running game turn the corner in 2016?
Before I looked at the numbers, I thought K-State took a decent step forward last season running the ball. But the numbers disagree. The Wildcats averaged 3.7 yards per carry in 2014, ranking 101st nationally and eighth in the Big 12. In 2015, they averaged 3.9 yards per rush, ranking 101st in the country and eighth in the conference. Averaging less than 4 yards per rush each of the last two seasons is a concerning number for an offense that prides itself on being able to run the ball. And that number must change in 2016.
K-State struggled so much in the passing game last season that teams could gear up to take away the run. And if it weren’t for the high number of sacks allowed, the Wildcats would have averaged more than 4 yards per rush. So that gives last year a bit of a pass. But in 2014, K-State was one of the best passing teams in the country and still couldn’t run the ball effectively when teams geared up to stop Lockett. So is this a trend or can the Wildcats get back to being a good running team?
An improved passing game should help. Opponents will likely have to respect the pass more this season, which should help out K-State’s offensive line and running backs. The Wildcats will need to be a good running team to take a little pressure off the young offensive line in pass protection. If the Wildcats can run the ball effectively, it will make the play-action pass more effective, slowing down the opposing pass rush and will help keep K-State out of predictable passing situations, which can create stress on the youthful line.
The Wildcats return a full stable of running backs. Charles Jones took a step forward last season, averaging 5.2 yards per rush over his final nine games and returns for his senior season. Justin Silmon comes into his sophomore year after averaging 4.6 yards per rush last season. The Wildcats could use more big plays in the running game, so getting Dalvin Warmack on the field and at least a few touches a game could help. And keep an eye on redshirt freshman Alex Barnes at running back, who has made a positive impression on the coaching staff.
K-State yards per carry the past two seasons
| Season | Yards per rush | National Ranking |
| 2015 | 3.9 | 101 |
| 2014 | 3.7 | 101 |
| Average | 3.8 | 101 |
K-State yards per carry from 2009-13
| Season | Yards per rush | National Ranking |
| 2013 | 4.5 | 53 |
| 2012 | 4.8 | 38 |
| 2011 | 4.0 | 69 |
| 2010 | 4.7 | 30 |
| 2009 | 4.3 | 57 |
| Average | 4.5 | 49 |
Overall
The offensive numbers in both the passing and running game were bad last season. Yet K-State averaged 2.24 points per drive, ranking 55th in the country. So credit to the coaching staff for still getting some production from a unit that lacked playmakers, but the 2.24 points per drive is the lowest the Wildcats have average since 2009, Snyder’s first season back on the sidelines.
If the Wildcats can stay healthy, the offense should take a significant step forward this season. There’s more speed at the skill positions and that should lead to an increase in explosive plays. The key will be the offensive line. If they can come together by Big 12 play, the K-State offense could be fun to watch this season.
Total offense numbers during Snyder’s 24 seasons at K-State (note that points per drive has been tracked by Brian Fremeau at bcftoys.com since 2007)
| Season | Yards per play | Points per drive |
| 2015 | 4.9 | 2.24 (No. 55) |
| 2014 | 6.2 | 2.92 (No. 12) |
| 2013 | 6.3 | 2.89 (No. 16) |
| 2012 | 6.2 | 3.16 (No. 7) |
| 2011 | 4.9 | 2.33 (No. 78) |
| 2010 | 5.8 | 2.63 (No. 24) |
| 2009 | 5.2 | 1.71 (No. 86) |
| 2005 | 5.0 | N/A |
| 2004 | 5.0 | N/A |
| 2003 | 6.3 | N/A |
| 2002 | 6.3 | N/A |
| 2001 | 5.1 | N/A |
| 2000 | 5.7 | N/A |
| 1999 | 5.3 | N/A |
| 1998 | 6.5 | N/A |
| 1997 | 5.5 | N/A |
| 1996 | 4.8 | N/A |
| 1995 | 5.5 | N/A |
| 1994 | 5.3 | N/A |
| 1993 | 5.1 | N/A |
| 1992 | 3.9 | N/A |
| 1991 | 5.2 | N/A |
| 1990 | 4.8 | N/A |
| 1989 | 3.9 | N/A |
*K-State’s 4.9 yards per offensive play in 2015 tied for the second-lowest since 1992.*